Gametogenic ecology of Antarctic Brittle Star;
Ophionotus victoriae
Abstract
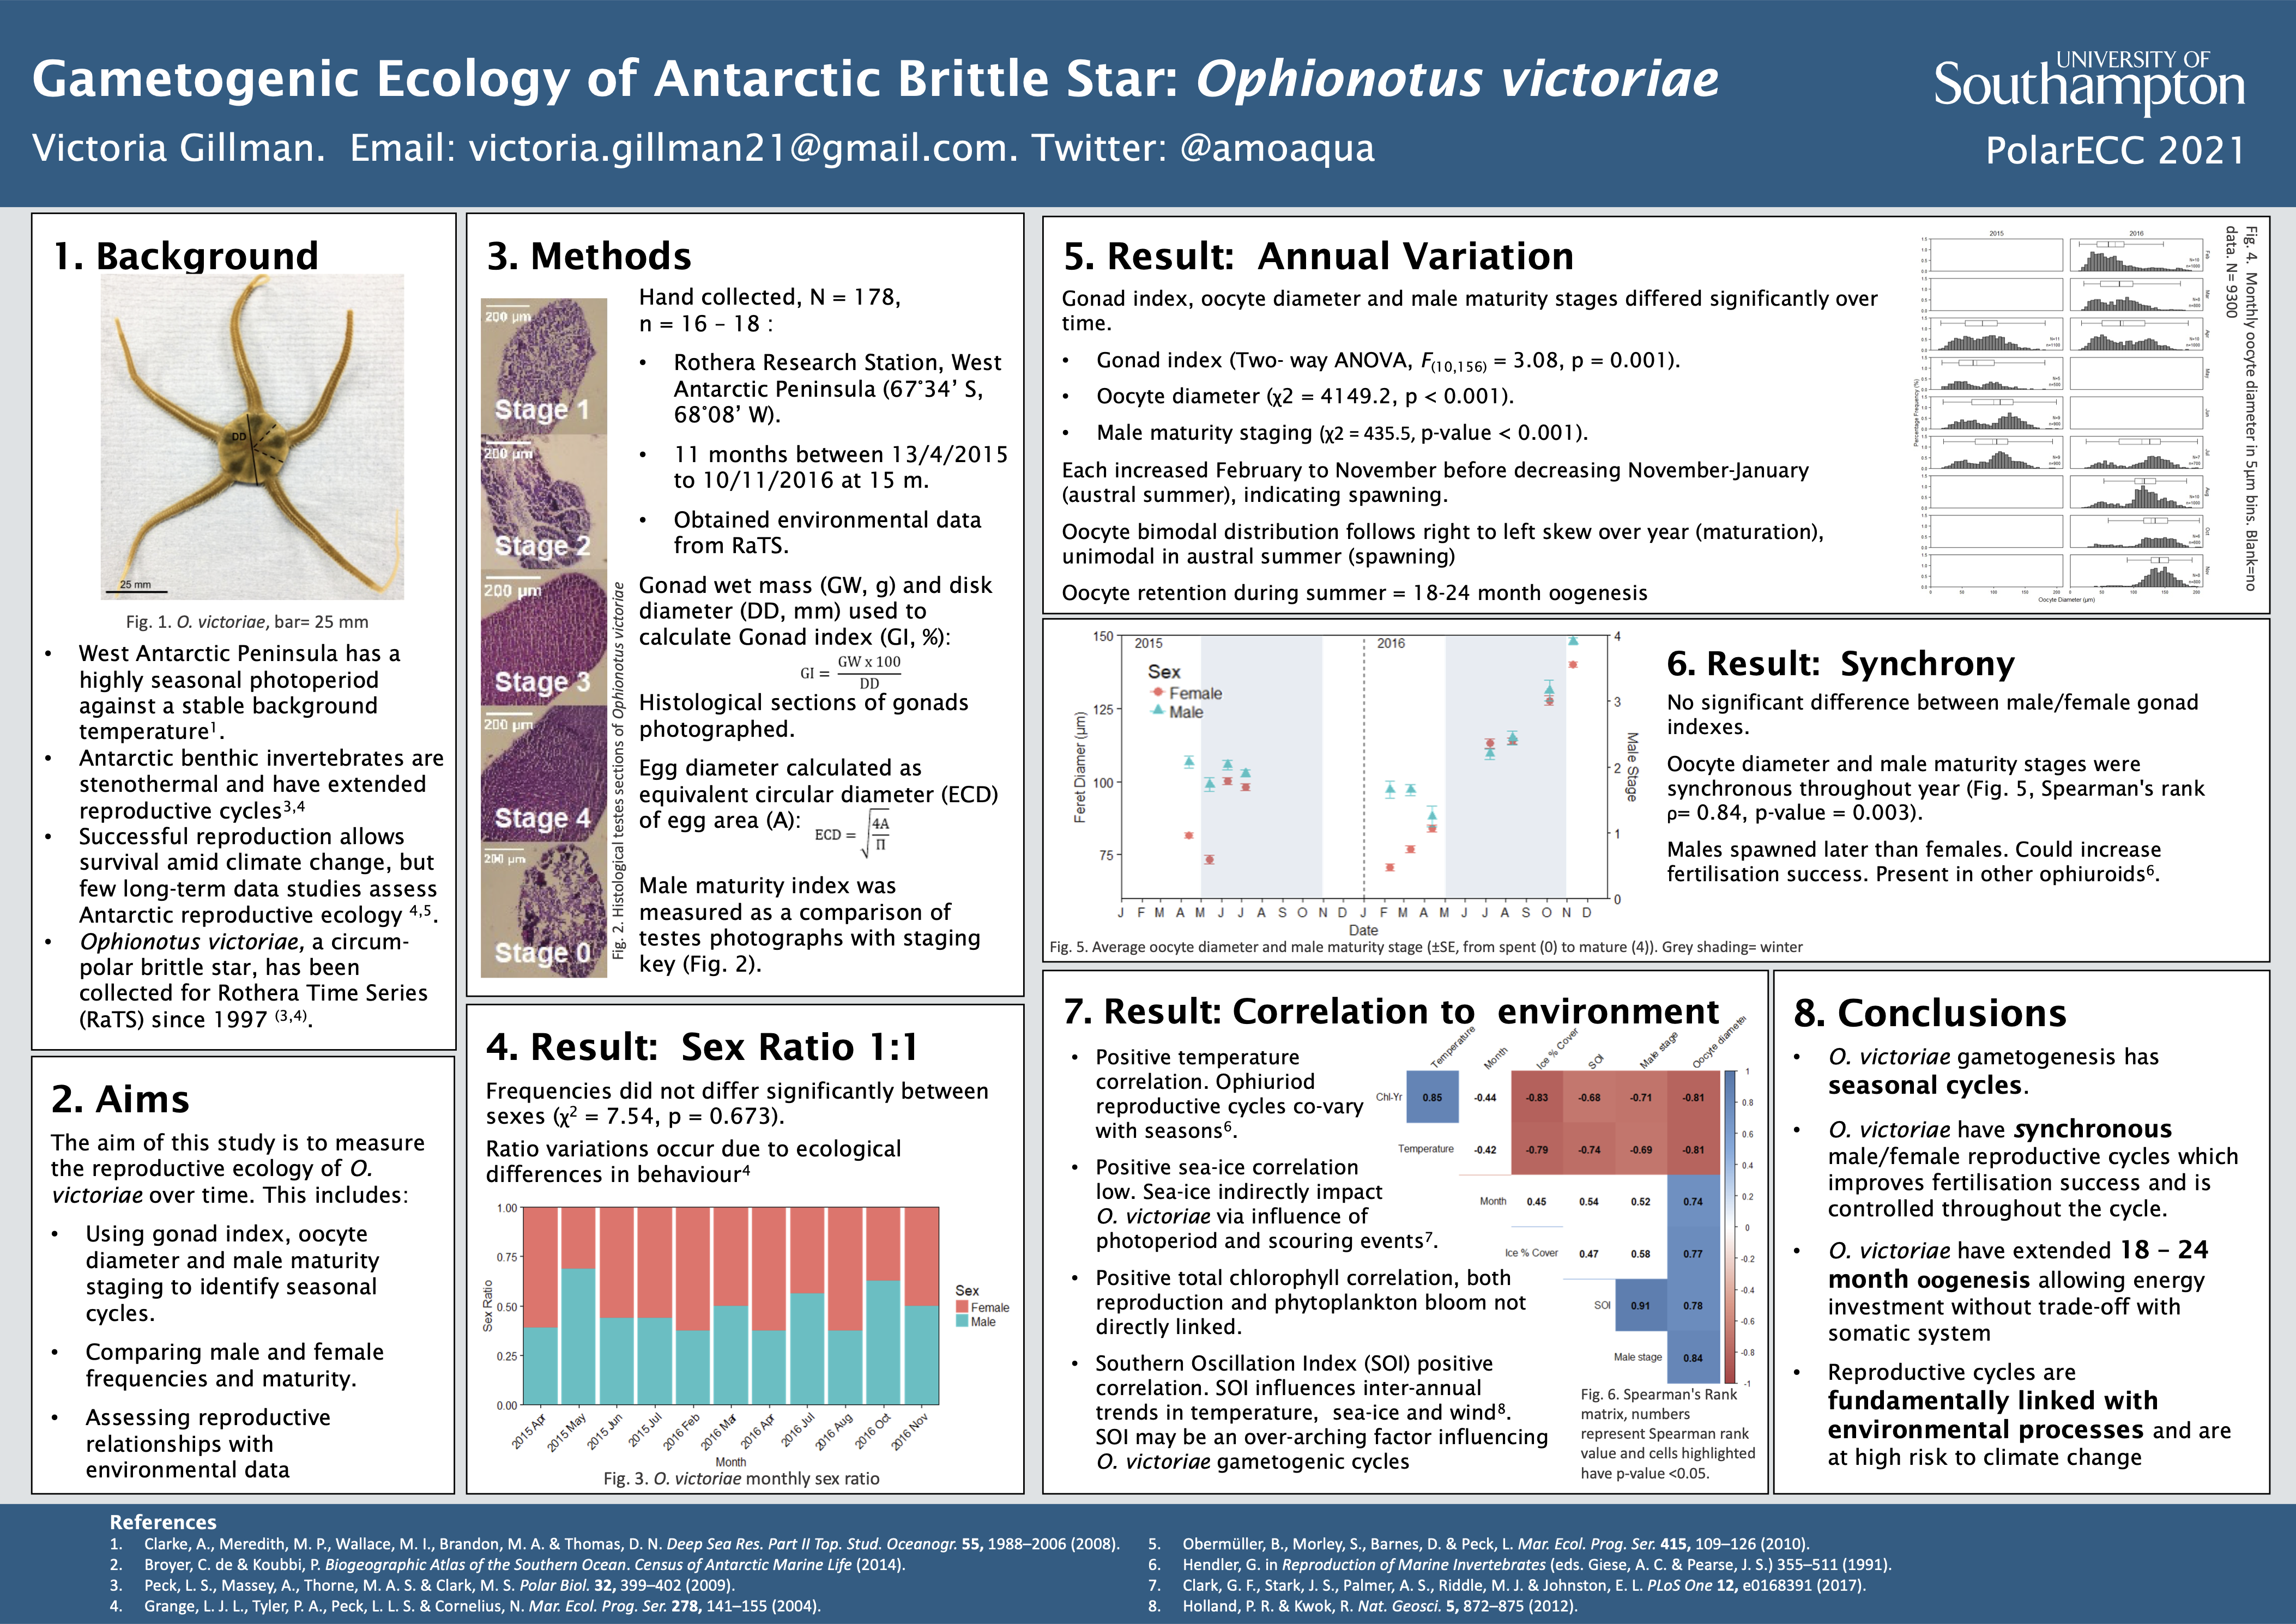
In the shallow Western Antarctic Peninsula (WAP), benthic systems are intimately linked with the pelagic and the climate. Using time-series to define benthic invertebrate reproductive ecology can demonstrate the influence of other ecological processes and periodicities and provide baselines for monitoring change. Ophiuroid Ophionotus victoriae is an opportunistic generalist that is dominant on the shallow WAP. Gametogenesis at monthly intervals from April 2015 to November 2016, was investigated to corroborate previous research and identify physical drivers of their reproductive cycle. A seasonal signal in gonad index, oocyte diameter and male maturity measurements was found, increasing over each year until a significant decrease in November to January (austral summer). Maturity was synchronous between testes and ovaries over the full study period, indicating exogenous control of O. victoriae gametogenic processes. Maturity for both males and females correlated with temperature, Southern Oscillation Index and chlorophyll concentrations of the previous year. Oocyte diameter further correlated with percentage ice cover. These indicate influence of exogenous factors on O. victoriae, demonstrating potential impacts of climate change. This data and analysis contributed to the British Antarctic Survey’s Rothera Antarctic Time Series, where reproductive cycles of O. victoriae have been measured since 1997 and will guide future investigations.
My integrated masters thesis at the University of Southampton
Supervised by Dr Laura Grange
Labwork and organisation
I worked on my thesis for nine months between September 2017 to June 2018. My thesis used histology and was very labwork heavy. My supervisor, Dr Laura Grange had samples of brittle stars collected from the Rothera Antarctic Time series. I was responsible for organising my time to dissect the 178 individuals, infill with wax and stain for photographic analysis. I measured 100 eggs per female which resulted in my analysis of over 10,000 individual data points
Analysis in R - Self taught R data management, statistics and visualisation
At this time my supervisor had her methods based in excel. I migrated these over to R and devoloped reusable code for future projects e.g. continuation of the time series.
Poster